
To access this dashboard, navigate to "Dashboard" 
in the upper left corner of the UI, under the "SKUPREME LOGO".
This dashboard shows your sales metrics. You can search or filter by SKU, marketplace, or region. You have full control of your sales metrics, revenue, and costs. In the top right corner, you can choose the period of the reported values.
This helps you project and analyze your business.


1. Net Sales calculator presents the total value of the sales.
.

2. Net Profit represents the total value of profit your organization earns after deducting all expenses from your Net Sales in the designated period.
3. The Orders Created  section presents all the orders fulfilled in the designated period.
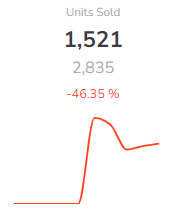
4. Units Sold represents the total number of units sold in the designated time period
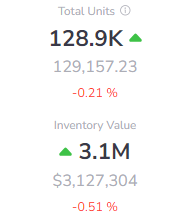
5. Тotal units report shows the total units available in all the warehouses and
6. The inventory valuation report shows the total value of the inventory by the listing price.
The dashboard also shows the Profits and Losses. To get a comprehensive view of your profits and losses, you may need to combine data from SKUPREME with your financial records, including costs, expenses, and other financial transactions.
For this calculation, we use gross sales, units, net, cost, and gross profit and obtain the margin.
All this data can be exported from:
